Tag Archives: Modeling

Adding Friction: N2L Labs That Work

I recently wrote about some Newton’s 2nd Law Labs that have actually worked for students to get solid data. One negative, however, is that they are all single force labs. I set out, as a result, to find another lab that would work for students. Caveat; I haven’t actually performed this lab with students. We are past our Unbalanced Forces unit, and I collected this data myself just to see how well it would work; astonishingly well, it turns out.

All I did was add a friction block being towed by the cart in a modified Atwood setup where the tension is measured directly (see last post for more information on that setup).

mod atwood cart setup

I’ve done a similar lab in the past, using just the friction block. The problem there is that there is a very narrow range of hanging masses that work; once it starts accelerating from a mass, a small addition of mass results in large increases in acceleration and thus difficultly in getting good measurements. This version, however, has enough system mass where hanging masses from 50-100 grams gave very nice results.

screen shot 2019-01-26 at 5.52.26 am

I first pulled the cart at a constant velocity, and measured friction directly as 0.37 \pm 0.03 \ N, where I used the mean and standard deviation of the force vs. time graph for those values. The mass of the system of the cart and block was measured to be 0.554 \ kg. The N2L equation, linearized, is F_t=ma+F_f, so the slope should be the mass of the system and the intercept should equal friction. The results show below that we are well within uncertainties on those values.

screen shot 2019-01-26 at 5.57.45 am

The trend is nice, the accelerations are reasonable and therefore should be relatively easy to collect, and best of all, it’s a simple extension of a lab students have already performed. I’m excited to try this with my students in the future. I may even do the first version with the block on top of the cart so that the only change in the 2nd version is the addition of friction; the system mass stays the same, thus so does the slope, but the intercept changes.

Newton’s 2nd Law Labs that Work

Modified Atwood with Ft measured directlyIn the last few years I have finally found some N2L labs where students in a general level physics class can consistently get decent data. I have compiled those labs here for use and modification. Below are some teacher notes about these labs.

First of all, the course for which these were designed is a general level physics course taken by a high population of seniors (approximately 1/4 of the graduating class), most of whom are not going into science. Those going into science tend to take our AP offerings.

Another thing to notice is that I have students plot acceleration as the horizontal variable and force as the vertical, knowing that this violates the x: independent variable, y: dependent variable guideline. I think doing so has two benefits; it allows for the slope of the line to be easily recognized as the mass of the system, and it shows students that we can manipulate the axes if it is convenient to do so, a precursor to linearization. The guideline is in fact only a guideline.

The fan cart lab is obviously only possible with fan carts. I got lucky this year and was able to pull them together. I have the pasco carts ($250 each!), but vernier makes a cheaper version ($105 each). I can’t speak to the effectiveness of the vernier carts as I have never used them.

I am confident that the force readings for both the cart on a ramp and the fan cart labs could be done with decent spring scales rather than force probes. Modified Atwood, however, requires force probes. I like the direct measure of tension as it takes away the black box of Modified Atwood setups where masses have to be switched from the cart to the hanging mass; I am confident that my students wouldn’t understand the nuance there unless we dived deep into it, and I prefer to make the system pretty obvious (the cart by itself).

I have also done the modified Atwood lab with friction blocks with some success. It is more difficult, however, for students to consistently get good results. There is a pretty narrow range of masses that will actually accelerate the cart, but not too much so that acceleration is difficult to measure.

The last thing to note is that I set aside at least two 45 minute class periods for each lab. Generally the first day is data collection and the second is analysis and discussion (often a board meeting where students compile data on a whiteboard and then we compare their results). I try to have groups with different masses for both the fan cart and modified Atwood labs so that the relationship between slope and mass is more obvious. I like having a day between collection and analysis where students can work on something else, that way if students were gone or their data didn’t work out well they can perform the lab on that in-between day.  Any lab worth doing is worth doing again!

Let me know in the comments or on twitter if you have questions or ideas!

Google Doc of N2L labs that work

Reluctant Participants and Board Meetings

As I start my 3rd year of Modeling Instruction, I’m happy to be in a place where I can start tweaking rather than making sweeping changes to my courses. My primary goal this year is to give more help and attention to students who struggle, and one of the ways I plan to do this is to pointedly seek methods for engaging them more during class. My first plan of attach on this concerns board meetings.

If you are not familiar, a “board meeting” is loosely defined as having students form a large circle so that they can observe each group’s whiteboards. I typically use this method of whiteboarding to have groups compare data from the same lab in order to induce aspects of a particular model. 

Despite having 25 students in a class, I noticed last year that board meetings tended to be dominated by less than 5 people. I want to try to get all the students involved; I want them all contributing and wrestling with the data. This year I’m going to have board meetings start by giving students 1-2 minutes to simply look around and make at least one observation. I want them to do this silently, individually. I think that sometimes there are students (like me) who are comfortable word-vomiting immediately about what they see, which then overwhelms students who prefer to sit back, take in info, and process before speaking. I want to give that second group time to process. After this time period, I’m going to have them turn to share their observation with the person next to them. Again, I want every single student in the room interacting about the data. After that I think I’ll have them go around the circle to share with the whole group. I thought about letting groups volunteer or cold-calling on groups, but by going around the circle I can step out and simply record their thoughts with minimal guidance and intervention.  As groups report in, I think I’ll stick with my observations/claims approach to help students organize the information reported out. 

I think throughout the year I will slowly remove the scaffolds like turning to partner or going around the circle in favor of more organic approaches, but I’m thinking I’d keep the 1-2 minutes of process time. I really want to help the processors engage before the vomiters get in their way. 

I know this isn’t new in general (yeah, yeah, it’s basically ‘think pair share’), but I think applying the idea specifically to a board meeting has some merit. I’ll report back with how it goes. I’ll also hopefully be posting with other possibilities for getting *all* students engaging in the various aspects of a modeling classroom. 

UPDATE: I did this will all my classes and I believe it was very successful. In addition, we had finished collecting data in one class period but didn’t have time to whiteboard it, so I had them put it in their lab notebooks (sketch a graph, record the equation in words, write the slope and intercept with units and uncertainties), and then to write a couple of sentences summarizing what the results meant. When they came back the next day, I had them take 2 minutes to discuss their paragraphs with each other. I like that this both helped them think about the data first, and then also incorporated some writing, which I hope to do more. After discussing their summaries, I had them gather in a circle and do what I described above. I really believe that this process helped get more students directly involved in wrestling with the data than only doing a standard board meeting. 

I want to thank Patrick Briggs, who keynoted for our all-district kickoff yesterday, for explicitly pointing out  that many students need time to think and prepare before they are willing/able to have an academic conversation.  

The Flipped Classroom and Student Dialogue (or, Why I Became a Modeler)

Recently I have become fascinated with the research around how students learn though dialogue. My favorite piece of quick evidence is Derek Muller’s TED application video where he presents his research about videos for learning.

You really should take the six minutes to watch the video, but the summary is that he tested two types of instructional videos; direct instruction and instruction through dialogue. Students who watched the direct instruction videos said they were clear and easy to understand, yet their test scores did not increase. Students who watched the dialogue videos said they were confusing and didn’t like them, but their scores increased significantly. Interesting.

Similarly interesting to me is the recent obsession in the education world with the ‘flipped classroom.’ There seems to be some evidence that flipping the classroom does indeed increase learning; my question is why. The article on flipping linked above has an entire section on how student-student and student-teacher interactions significantly increase with the flipped model. Is this the primary reason flipping succeeds? If so, then why the obsession with video lectures and programs like Khan Academy? Is the video piece even necessary? Before I dive into this I want to give you a picture of where I am coming from with all of this.

I have taken a long road to get to where I am today as a teacher. I started teaching physics in the fall of 2005 with very little knowledge of how students learn, particularly the vast amounts of Physics Education Research (PER) that has been conducted in the last 30 years since the development of the Force Concept Inventory (FCI). I started a Masters degree in 2007, and through the research for my thesis on inquiry in physics I stumbled upon the FCI. I pre-posted my students for the first time in the 07-08 school year. Though my average postest score of 47% is above a national average for traditional teaching of 42%, I was pretty dismayed. Really? After a whole year of physics my students can’t even answer half of the FCI questions correctly? Not ok.

My research showed slightly higher student gains with inquiry, and, particularly interesting, that the standard deviation of the scores shrunk. My interpretation was that the high end learners gained about the same, while the low end learners gained more with inquiry. That’s good. But it wasn’t enough. In 5 years, my scores never got above 50%.1

I knew my kids weren’t really getting it, but I didn’t know what to do about it. Enter grad school #2. I decided in the spring of 2010 that I wanted to learn more about Educational Technology, so I enrolled in online courses at Mankato State University. I decided to research clickers (student response systems) for one of my papers, and I stumbled upon Eric Mazur’s work on Peer Instruction (PI). PI is a technique developed primarily for large lecture clases. The idea is that a multiple choice conceptual question is posed, and students answer via clickers (though this can work with low-tech solutions like raising a piece of paper with the answer on it). Particularly if the distribution is evenly split, the instructor has the students talk to each other, and then re-answer. More often than not (in my own experience) the distribution shifts towards the correct answer. Mazur has some great research out there about how students are able to reason to each other better than an expert, thus their explanations often make more sense. More importantly, the process of the discussion is another form of the dialogue used by Muller, and my suspicion is that in this lies the reason for understanding gains.

The following summer a colleague from another school in Minnesota mentioned Modeling Instruction (MI) to me. Dialogue and Inquiry are both central to MI. The modeling cycle typically starts with a paradigm lab where students use guided inquiry to investigate a phenomena. From there the phenomena, or Model, is expanded and refined, often through White Boarding. The idea is that student interaction, questioning, and revising of ideas drives the learning. And it works.

So we have Muller and his video instruction with dialogue, Peer Instruction with dialogue in large lecture classes, Modeling with dialogue in the form of white boarding, and the general idea of flipping the classroom. Most of the praise I have heard about for flipping is that it provides more time for projects, problem solving, and other more interactive methods of learning than when the teachers ‘had’ to lecture during the hour. I have to wonder if the problem is simply that lecture doesn’t work, period? Does flipping work only because teachers who flip are using techniques during class that actually do help students learn? Do the videos really have anything to do with it, if they are just direct instruction?

I will say that with both PI and MI require that before the conversation takes place students should be familiar with the problem at hand. I recall research (but can’t find at the moment) that showed gains in understanding when students worked on a problem before it was used as an example in class. The standard MI white boarding process involves students first working on the problems on their own (often as homework), then comparing in their group, then presenting their agreed upon solution to the class for more dialogue. PI requires them to first answer with their own reasoning, then compare that to another’s. Do out of class videos serve this same purpose?

I don’t feel like I have an answer to lots of the questions I have posed above. However, the main point I want to get across is that I think it is silly to focus the flipped classroom conversation on what takes place outside of  class; the power of flipping (which I would then argue is really the power of quality instruction) is the changes that can be made inside the class to promote student learning. Let’s just focus on how students actually learn, then teach them guide them to understanding using effective methods.

UPDATE: Here’s another resource that discusses the use of dialogue in Physics classes, though some of the information is the same as those listed above. The Art (and Science) of  Questioning via Clickers (podcast).

1 This is for the general level physics classes. It is noteworthy that my advanced classes have scored significantly higher. In the two years I have been testing them they have posttest averaged around 70%. Though this number is much higher, I am not satisfied with what would equate (in a standard grading scale) to a C- average, particularly with advanced kids. I do think it is interesting, however, that with essentially the same type of instruction these kids score so much higher. It is probably a combination of three things, in my estimation. 1) Higher scientific reasoning skills, which makes me wish I had given Lawson’s Classroom Test of Scientific Reasoning. I don’t want to over-test though. 2) More depth, both mathematical and conceptual, in the advanced class.   3) The idea that students who make it to the advanced classes are those who are able to have more internal dialogue and compare what they are learning to their own understanding without the need for the external dialogue. This may correlate to number 1, though.

What is a Model?

(The image above is part of The Modeling Comic that one of my students created last year)

I’ve been struggling for some time with the idea of a Model (within the construct of Modeling Instruction). Back up with me for a bit. In the summer of 2011 a colleague who teaches at another school in Minnesota introduced me briefly to Modeling Instruction. Being who I am, that is, someone who loves to learn, I promptly found a community of modelers on Twitter and learned quite a bit from blogs by Kelly O’shea, Frank Noschese, and Scott Thomas. I found out the hard way, however, that I had a fairly limited view of what a Model actually is.

In my excitement to get started Modeling I got stuck in a rut of thinking that 1) equations were physics (a statement I would never say to students but found myself thinking), and 2) that a model was an equation. For example, the CVPM model, to me, was x=xi+vt. Through the process of attempting modeling throughout the year, failing some, succeeding some, reading blogs, and finally taking the Modeling Instruction training this summer, I think I have a much better picture of what a Model actually is.  The training was instrumental in my formation of a definition of a model, as was Sam Evan’s post on what it means to model. So let’s get to the good stuff.

I believe that a Model could be defined as a particular phenomenon that is described using a set of representations (diagrams, equations, descriptions, charts, graphs, and more). These representations should produce accurate and reproducible predictions for and explanations of the phenomenon, within the limitations of the model. This makes it very hard to use a representation to describe the model, because the model is about the phenomena, not the representation. The Constant Velocity Particle Model (CVPM) is not linear position vs. time graphs nor equally spaced motion diagrams. CVPM is a type of motion that occurs when neither speed nor direction are of an object are changing.

To demonstrate what I think a model is in terms of MI, I am going to use a model that is well known to the science community; the Bohr model.

The Bohr model is a the idea (concept? model?) that the nucleus of an atom is surrounded by electrons whipping around in fixed orbits. 

The Bohr Model was proposed by Niels Bohr in an attempt to explain emission spectra, which it did fairly well for Hydrogen. Representations for The Bohr Model include the planetary-style diagram shown above and energy level diagrams (below).

Two notable equations are used to represent The Bohr Model; the allowed Bohr radii formula

and the allowed energy levels known as the Rydberg energies

.

The Rydberg energies also have a more general form for atoms with more than one proton in the nucleus;

.

We have a number of representations above that attempt to describe the model. The cool thing, I think, in using The Bohr Model as an analogy for how Modeling Instruction is structured is that the model can be broken. That is, the model is useful under certain conditions, but must be modified when extending beyond those conditions. It turns out that the phenomena of atoms is more complex than the relatively simple Bohr Model had suggested.

This is actually a good analogy to CVPM leading into the Constant Accleration Particle Model (CAPM),  as CVPM is really a subset of CAPM for acceleration=0. The Bohr model works well for hydrogen because there are no other electrons interacting with the one that is ‘orbiting,’ thus Bohr’s assumptions work well; as soon as you add more electrons, the predicted emission spectra differs from the actual spectra and the model is broken. Using constant velocity to try to solve more complex motion problems where acceleration takes place is a bad idea, because the assumptions for CVPM no longer hold.

Still, because students need scaffolding and baby steps, it is pedagogically appropriate to teach CV before CA as a stepping stone; one could just teach CA, but it would be a bigger step to expect students to take. Similarly, the Bohr Model is the first step toward understanding quantum mechanics; in fact, it was a giant conceptual leap that allowed those who followed after Bohr to expand the model into something more complete.

I hope I have given some credence to what a Model is within the framework of Modeling Instruction. I very much appreciate any feedback you can give me!

Modeling Central Force: Day 3

Note: Since writing this post I have significantly changed how I start this unit; see new post here

I had three main objectives for my lesson today;

  1. Wrap up the modeling process, particularly figuring out that the proportionality constant for Tension vs. v2 should be m/r;
  2. Go through the awesome graphical derivation of centripetal acceleration
  3. Use the traditional spinning stopper lab as a goal-less problem.
1. We looked yesterday at the ‘A’ parameter of the quadratic, the one in front of v2. Generally students found A proportional to mass and inversely proportional to radius, which was good, but there was no clear pattern, so I started compiling data. This is one class’s data; looking at it this way made me excited for the possibility of having computers in my room so I can easily compile using Google Forms. This also allowed for sorting by radius or mass, which was useful. The students were quick to figure out that C should be zero, hence the yellow cell that indicates less-than-perfect data; we don’t trust that regression anymore. Despite that, their proportionality constant was better than most. Only half the class had reasonable constants; surely not enough for them to see the relationships perfectly. However, at least they were able to pick out the general trends. One thing I hope the Modeling Instruction workshop helps me with this summer is the perplexity of how some student groups get fantastic data and some awful with the same setup and instructions, when I often can’t seem to find the source of the problem (though time and class size contributes to the lack of problem solving as well). 
Velocity vectors on a circle

2. Next we went through the graphical derivation of

I had them working on their desks with whiteboards, and I guided them through the steps. I think that this derivation is fairly abstract for students’ to come up with on their own (though I dare you to get them to do so, please let me know if you do!). It went fairly well, and will be re-iterated when they do their pre-lab assignment which is essentially the same exercise. I like this one in particular because a)  it is super cool that you get a concise, elegant equation by doing a graphical proof, and b) I try to iterate that everything comes from somewhere (I use this for energy as well). Any equation we use can be re-derived using physics. These students are too used to 16 popping up in quadratic equations in Algebra II without any clue to the fact that it has significant physical meaning.

The last part was the best.

3. I ended today by demonstrating the spinning stopper lab and asking them to analyze it as a goal-less problem (which I haven’t done a ton, but I will be adding more; thanks to Kelly O’Shea for introducing me to this concept).

A student uses multiple viewpoints

The students ran with it, first figuring out that Ft=mg for the hanging mass, then using that to analyze the stopper. The cool thing was when one group (there’s always at least one in each class) figured out that the string must be at an angle as the y forces must balance. We then had a discussion about this, and I demonstrated that when the string goes quickly it is hard to see the angle.

Overall this last day went well, but would be better with solid data. Still, I definitely preferred using pendulums to the spinning stopper lab for the modeling aspect (to be honest, it’s not like I’m a veteran of modeling anyway…), though I would hope to find an even better way to model central force. Let me know if you have improvements!

Modeling Central Force: Day 2

Note: Since writing this post I have significantly changed how I start this unit; see new post here

Today we compared data.

I started class by asking students why the net force at the bottom of the arc was not zero. They realized quite quickly that forces should not be balanced since the direction of motion is changing (due significantly to previous emphasis on velocity as a vector, that is, when direction changes, velocity changes. Once again I credit Kelly O’Shea and her method for teaching BFPM for this). So then we drew a free body diagram and reasoned through which force should be bigger; tension up or mg down? They want to say down, but a quick discussion about what would happen if the net force was down dispels that idea. (Since the object is moving horizontally for the snapshot we have taken, a downward force would cause downward motion; clearly this is not the case.)

Side note #1: I want to mention why I didn’t do the typical rubber stopper lab (here’s a video if you are not familiar with that lab, ignore the flying pig part). I have done it for years, and I  found it at best to be an example of large systematic error. I actually had my honors classes write it up last year for that very purpose; how to write a lab with significant errors. I have never been able to get quality data, especially with students. I find that they even have trouble getting a good pattern for F proportional to square of v. Thus I wanted to try something new, and the pendulum method was something I had done previously as well and was suggested by another modeler on twitter as well (@BEPhysics). I found two main negatives for using this particular lab to build central force; 1) the data we take and the resulting analysis are only valid for the bottom of the circle, and 2) though it is true that F_net is greatest at the bottom of the circle, this lab falsely ‘proves’ that, in that force vs. time data shows a maximum at the bottom, but that is more due to the fact that the force detector is pointed vertically and thus only reads the vertical component of the tension. Even if this supports an overall correct vision, I don’t like the idea that kids would get the correct vision from an incorrect assumption. 

Then looking at the regressions as a whole, we re-confirmed that the data was quadratic, that is, that the net force on a pendulum at the bottom of it’s swing is proportional to the square of the speed at the bottom. That’s cool all by itself.

Next I had students looking for other patterns (what happens as r and m change?). I had them stay in their clusters first (see Modeling Central Force: Day 1 for more on this). This meant that they had different masses but approximately the same radius, and thus could look for mass dependence.

Side note #2: I have a lot of questions/problems with this part of the Modeling process that I hope will be addressed when I take the workshop this summer. I am still wrestling with the best way to have students share their data with each other to start finding the patterns. I also think that I need to bite the bullet and go get some large whiteboards; I have whiteboard desks and lots of space on my main whiteboard, but neither of those are portable, and using them has proven to be more of a workaround than something better than actual whiteboards.

I learned a lot about the guidance part of modeling in this particular instance. I really should have been more systematic in defining the radius and mass for each group. In one class, two clusters should have had different radii but were only different by 5 cm or so. More so, it would have been VERY helpful if each cluster had consistent masses, so that when they compared radius dependence they could do so with constant mass.

So here’s an example of what I was trying to do with the pairs/clusters concept, which was less successful than could have been due to my ambitiousness in directions.

This would have made the comparison process MUCH easier, I believe, as I could have them get into ‘clusters’ to check for mass dependence, and get into ‘groups’ for radius dependence. This is something I am going to consider trying later if I have other labs with two main parameters such as this.

Most groups had some sort of mass proportional to net force kind of data, but it was not obvious due flawed data. Data was VERY quadratic, but the actual parameters for the quadratic generally were not even close to what they should be. The A term (f(x)=Ax^2+Bx+C) should be m/r, but generally wasn’t. Some groups even had significant outliers; they had a larger mass than another group with the same radius, but the A terms were similar. Bad data was a big problem for this; in fact, NONE of the groups found the ‘correct’ terms for the quadratic (I found this out in analyzing the data later; we didn’t go so far in class to check). I didn’t have enough time to investigate reasons for this, though the fact that students and I can do the same lab with completely different results (meaning good vs. bad data) has been driving me nuts this year. Non-zero B values were a problem as well; though students were astute enough to realize the C had to be zero physically (Zero speed had to yield balanced forces, so if F_net was to be zero with v=0, C must equal zero) and thus it became a sort of litmus test for good data. C not zero? Now we don’t trust the rest of your regression. This worked reasonably well. B should be zero as well, but that was only true in the best of cases.

That said, in two out of three classes the data was convincing enough to show that F_net is proportional to mass and inversely proportional to radius. I used one of the other classes data sets to show the bad data class what was up (their data was truly horrible; no noticeable patterns at all! Very frustrating, both for them and for me). Thus

I asked what this seemed similar to; hey, it’s kind of like F_net=ma! Yes, yes it is. Meaning that

And this is where we ended for the day. (Note: It got much less frustrating for the wrap up tomorrow, which I will be posting asap)

Side note #3: I have been wondering to myself for quite some time about the rationale for linearizing. It seems as though it is something that made lots of sense 30 years ago, before we could graph any function in 2 seconds with a hand-held device. Now, however, why linearize? I don’t think I even learned how until teaching AP Physics, as in college we would simply deal with the actual functions, whatever they were. I would love some input on this. In this case, I linearized for one class and, as expected, the slope was essentially equal to the A in the quadratic while the intercept is equal to the B value. So why bother? 

Modeling Central Force: Day 1

Note: Since writing this post I have significantly changed how I start this unit; see new post here

Today, which happened to be Pi day,  we started circular motion. Too perfect. I wanted to start the unit by building a model for centripetal acceleration, similar to the way I started my momentum unit. We had briefly (for a couple of minutes) looked at circular motion when we built the balanced force particle model, the methods for which I stole from Kelly O’Shea (the Kick Dis puck is amazing for this! Seriously check out her post on BFPM). But that was quite a while ago.

I started class by telling them that we were going to investigate circular motion, specifically the snapshot at the bottom of a vertical circle. I told them how to set it up, showed them how to vary the height so the speed is varied (and had a side-note conversation about why the height is the only thing that can change the speed at the bottom; gravity is the only force doing work), and showed them how the photogates will take a velocity measurement using the diameter of the mass. I had each person find a partner (I group them for formal labs but have been generally letting them form their own groups for modeling, that will change soon just to switch things up), and then I had the pairs find a ‘cluster’ as well. The idea is that each cluster would have a constant radius but different masses. Then I cut them loose.

One cool idea a student came up with almost right away was that if you zero the force detector with the hanging mass on it, it reads the net force. I was planning on having them subtract the weight of the hanging mass after zeroing with nothing on the detector; how awesome that a kid figured out a much better way to do it! Another student showed me how to Use a smartphone for the diameter  of the pendulum mass with the smart ruler app, picture at right. I love learning from students!

Pairs then clusters

One thing I did that I liked for this round of modeling was the idea that students have a partner with which they collect data, then a ‘cluster’ of 3-4 pairs to compare data. Each cluster had a constant radius but different masses, so they could investigate the effect that mass has when the radius is constant. Then I had the clusters mix to look at the effect of same mass with different radius, but more on that later.

Quotes and moments

“It’s really entertaining watching the force in real time. It’s like someone’s having a heart attack!”

At one point I tried to engage one pair in conversation about something trivial. They ignored me so they could keep taking data. It was a proud moment for me as an educator.

“It’s something different!”

Wrapping up

Today was mainly a data collection day, but most groups got the the point of plotting F vs. v to see that it is quadratic, and this piece of the data worked out fairly well. Nice quadratic graphs for most groups, which was certainly a good start. Tomorrow we look for patterns.

Modeling Momentum: Student Reflections

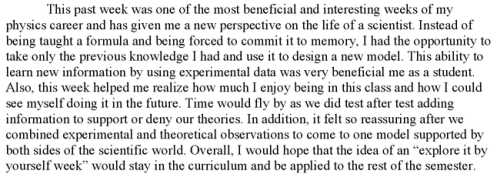
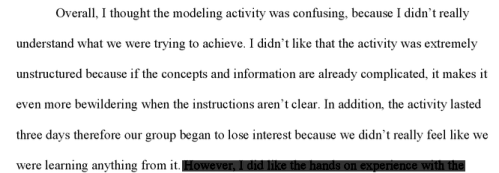
I recently blogged about my first large-scale implementation of modeling with my higher level physics students. After that experience I had them write a reflection. To be honest, I was looking more along the lines of ‘did they get it,’ and I was thinking of using reflections as the way to assess the modeling process; this was a sort of test-run for that idea. However, because I was (purposefully) vague in what I wanted from the reflections, I found out more about the modeling process than I did about my students’ understanding. Turns out that is pretty awesome.

The Positive

I’ll start with some of the positive comments, with screenshots below.

The next student stated that she didn’t get as much out of the modeling process itself as she felt she could have. However, she liked the culmination of looking at the model from a theory perspective (deriving conservation of momentum using Newton’s 2nd and 3rd laws), which they again did on their own;

A couple of students noted that they felt like they were doing ‘real’ science by participating in modeling;

A couple of students noted that they were frustrated during the process but saw the value in hindsight;

There were a few ‘meta’ comments, where students explored the bigger picture, realizing that we were learning much more than simple conservation of momentum through the process;

It was also interesting that a number of students connected modeling with goal-less problems, of which I have only done a few. I’ll be looking more into those in the future, that much is certain!

Criticisms

Both students above were in groups that struggled (if I remember correctly). One of my goals in the future is to figure out how to stimulate those couple of groups who seem to quickly hit a wall. I do think that one aspect of that is that this was really my first full-scale, set them loose model building process, and that is not always going to go well, especially with very concrete learners. This was pointed out by one other comment;

Recommendations

I like the above thought a lot. In fact, I am now planning on modeling central forces next, and I think I am going to do some jigsawing by having certain groups test radius and others mass, then mix them to compare results. Post coming eventually on that!

I value this student’s thoughts; however, part of the larger value of Modeling Instruction is teaching students to learn for themselves, as pointed out by a student earlier (the ‘meta’ comment). It is my hope that a student with this viewpoint can come to see the value of starting from scratch, because it’s not just about the concept of momentum; it’s about doing science.

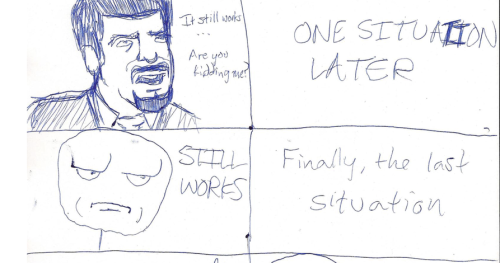
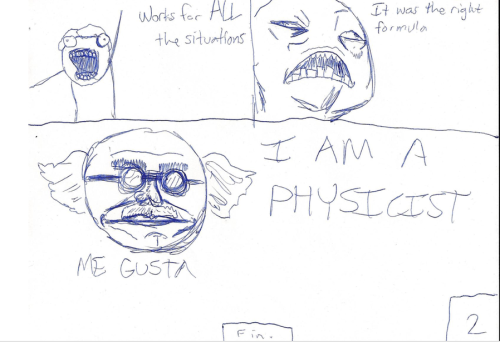
Lastly, one student did in fact include his Awesome Modeling Comic, which I couldn’t possibly leave out.

Awesome Things Kids Do: The Modeling Comic

One of the many benefits of teaching is the kids. They say goofy things, write messages to me on my whiteboard, play practical jokes (k, not so much my favorite), and are generally just fun to be around. As a result I have decided to start a new category where I will post periodically with something cool/interesting/fun that a kid did in my class. Which brings me to my first post in this series…

The Modeling Comic

A couple of weeks ago my classes delved into modeling for the first time. I had students write reflections about the process (post coming soon), and one student included this with his reflection. Too awesome not to post.